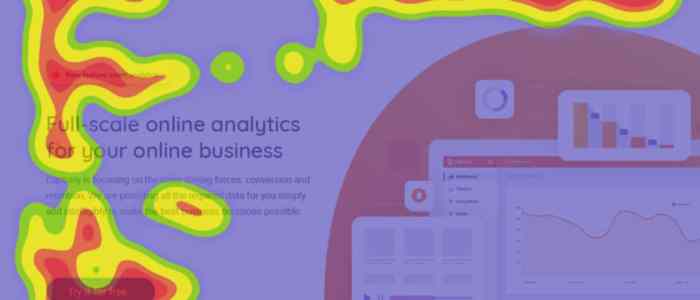
Using Heatmaps for UX shines a spotlight on the power of data visualization in improving user experience. Step into a world where design meets analytics, creating a seamless digital journey for all.
Introduction to Heatmaps

Heatmaps are visual representations of data that show the intensity of user interactions on a website or app. In the context of UX design, heatmaps are valuable tools that help designers understand how users engage with their products. By analyzing heatmaps, designers can gain insights into user behavior, identify areas of interest, and optimize the user experience.
Types of Heatmaps
- Click Heatmaps: Show where users click the most on a page, helping to identify popular or ignored elements.
- Scroll Heatmaps: Display how far down the page users scroll, indicating where content should be placed for maximum visibility.
- Move Heatmaps: Track mouse movements to understand how users navigate through a page, highlighting areas of interest.
- Attention Heatmaps: Combine click, scroll, and move data to provide a comprehensive view of user interaction patterns.
Benefits of Using Heatmaps for UX Analysis
- Identify User Behavior: Heatmaps allow designers to see how users interact with their interface, helping to optimize layout and content placement.
- Improve Usability: By analyzing heatmaps, designers can uncover usability issues and make informed decisions to enhance the overall user experience.
- Optimize Conversion Rates: Understanding user behavior through heatmaps can lead to improvements in conversion rates by focusing on key areas of user engagement.
- Data-Driven Decisions: Heatmaps provide visual data that can support design decisions based on actual user interactions rather than assumptions.
Implementing Heatmaps
Implementing heatmaps on a website or application can provide valuable insights into user behavior and interactions. By following these steps, you can seamlessly integrate heatmaps into your UX analysis.
Step-by-Step Integration
To integrate heatmaps, follow these steps:
- Choose a reliable heatmap tool or software for your specific needs.
- Install the heatmap tracking code on your website or application.
- Configure the heatmap settings to track relevant user interactions.
- Collect and analyze the heatmap data to gain insights into user behavior.
Tools and Software Examples
There are various tools and software available for generating heatmaps, including:
- Hotjar
- Crazy Egg
- Mouseflow
- ClickTale
These tools offer different features and functionalities, so choose one that aligns with your UX analysis goals.
Best Practices for Effective Implementation
To effectively implement heatmaps for UX analysis, consider the following best practices:
- Focus on specific user actions or behaviors to track with heatmaps.
- Regularly analyze heatmap data to identify patterns and trends.
- Combine heatmap data with other UX research methods for comprehensive insights.
- Optimize website or application design based on heatmap findings to enhance user experience.
By following these best practices, you can leverage heatmaps to improve the overall user experience of your digital platform.
Interpreting Heatmap Data: Using Heatmaps For UX

When it comes to interpreting heatmap data, understanding the different colors is key. Each color on a heatmap represents the intensity or frequency of user interaction on a specific area of a webpage. Typically, warmer colors like red or orange indicate areas with higher interaction, while cooler colors like blue or green represent areas with lower interaction.
Analyzing User Behavior, Using Heatmaps for UX
- Areas with red or orange colors indicate high engagement, showing where users are clicking or spending the most time.
- Conversely, areas with blue or green colors suggest low engagement, highlighting areas that may need improvement or further optimization.
- Patterns such as clusters of clicks or scrolls can reveal user preferences or points of interest on the page.
Key Metrics from Heatmap Analysis
- Click Heatmaps: Provide insights on the most clicked elements and help optimize call-to-action buttons or links.
- Scroll Heatmaps: Show how far users scroll down a page, indicating where important content should be placed.
- Mouse Movement Heatmaps: Display areas where users hover or move their cursor, indicating areas of interest or confusion.
Heatmaps for Improving User Experience
When it comes to improving user experience (UX) design, heatmaps can be a powerful tool to identify areas for enhancement and optimization. By analyzing user behavior and interactions with a website, heatmaps provide valuable insights that can help businesses make informed decisions to create a more user-friendly experience.
Identifying Problem Areas
Heatmaps can be used to pinpoint specific areas on a website that are not performing well or causing confusion for users. For example, a scroll heatmap can show how far down users are scrolling on a page, helping designers understand if important content is being missed. By identifying these problem areas, businesses can make necessary adjustments to improve the overall user experience.
Optimizing Layout and Content Placement
Heatmaps can also help optimize website layouts and content placement by showing where users are clicking the most. A click heatmap, for instance, can reveal popular navigation paths or areas of high engagement, allowing designers to strategically place important buttons or information for better visibility. This data-driven approach can lead to a more intuitive and user-friendly design.
Success Stories
Several companies have successfully used heatmaps to enhance user experience and drive business growth. For example, a popular e-commerce site used heatmaps to analyze user interactions and discovered that a particular product category was not receiving much attention. By redesigning the layout and placement of this category on the homepage, they saw a significant increase in clicks and sales. This demonstrates how heatmaps can play a crucial role in improving UX and ultimately boosting conversion rates.
